Understanding the Sales Valuation Report in PrestaShop 1.5
The Available Quantities for Sales Valuation (abbreviated in the Stats list as Available Quantities Stats) report is an important report in that it gives you the overall monetary value of your store in terms of your products. Using the statistics gleaned from this report you can determine your best selling stores if you have more than one store. This report is based on inventory that you have within your store, and will not reflect impending sales waiting on payment. The following tutorial explains the use of the report to determine the worth of your inventory, and how to view it within PrestaShop 1.5.
Viewing the Available Quantities for Sales Valuation Statistics Report in PrestaShop 1.5
- Log in to the PrestaShop Admin Dashboard as an Administrator
- Hover over the end of the menu bar to the right where it is labeled "STATS". Click on STATS when it appears in the drop-down menu.
- When you see the main STATS screen appear, go to the left-hand column labeled NAVIGATION, then click on AVAILABLE QUANTITIES STATS. You will see a report similar to the one below:
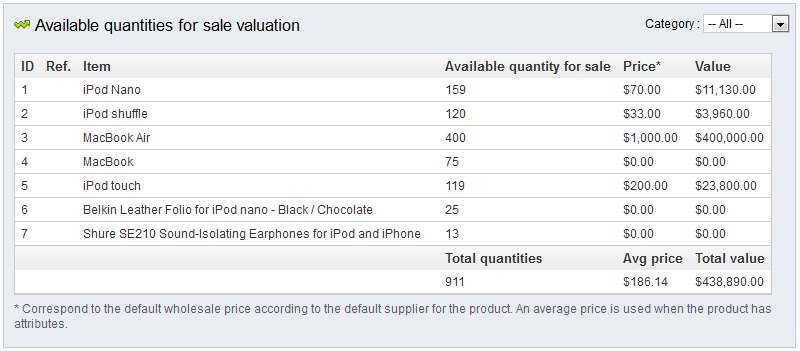
Note that in the top right hand corner there is a drop-down menu for CATEGORY. The categories listed match the categories that you have added to your shop. Below are definitions of the table columns from the above screenshot:
ID ID number of item in report Ref Ref ID for item Item Item Name Available quantity for sale inventory available for sale Price price per item available for sale Value Value of entire stock of item Total Quantities Total inventory for all items Avg Price Average price per item Total Value Sum total value for all items listed
Note that Price is changed to average price for the item if the item has attributes that may affect its pricing - Select the specific category for the report, or select ALL to see your total inventory's valuation.
Summary and Explanation of Data
The available quantities for sales valuation stats report is basically a report that simply goes through your inventory and totals its value in terms of the money or monies you are using for your shop. This is an excellent report to help you determine the worth of your current inventory value(s) so that you can compare it with a specific period of time. Viewing your inventory over time identifies trends with your overall sales, that you can later use to link to a specific region if you have multiple stores. Use this report to help you quickly determine your sales or lack thereof.
Did you find this article helpful?
Tweet
Category
Reports and Messages Prestashop 1.5
Help Center Login
Reports and Messages Prestashop 1.5
Related Questions
Here are a few questions related to this article that our customers have asked:
Ooops! It looks like there are no questions about this page.
Would you like to ask a question about this page? If so, click the button below!

We value your feedback!
There is a step or detail missing from the instructions.
The information is incorrect or out-of-date.
It does not resolve the question/problem I have.
new! - Enter your name and email address above and we will post your feedback in the comments on this page!