How to enable Debug Profiler in PrestaShop 1.5
PrestaShop's interface is easily modified both within the standard modules and also by custom coding. During these changes, a problem can occur that might be causing performance degradation to the site - in other words, the site might be loading slow. One of the ways to determine how well each page is loading, is to enable the debug profiler. This can be done with a a file edit. The following article explains how quickly activate this feature and where to locate the results of this feature.
Activating the Debug Profiler for PrestaShop 1.5
CAUTION: Make sure that you have created a backup of your website before performing the file edit. This allows you to return to the previous state before you make any changes. For further information on creating a backup go to Creating a Backup using FTP.
- Login to the Cpanel and go to your File Manager or login to your FTP client. We will be looking for a PHP file within the CONFIG sub-folder of your PrestaShop installation. If you need further information on using File Manager from the Cpanel or using FTP, go to Using File Manager in Cpanel and Getting Started Guide: FTP.
- Navigate to the files and folders that make up your PrestaShop 1.5x installation. Look for a folder called CONFIG and double-click on it to open it.
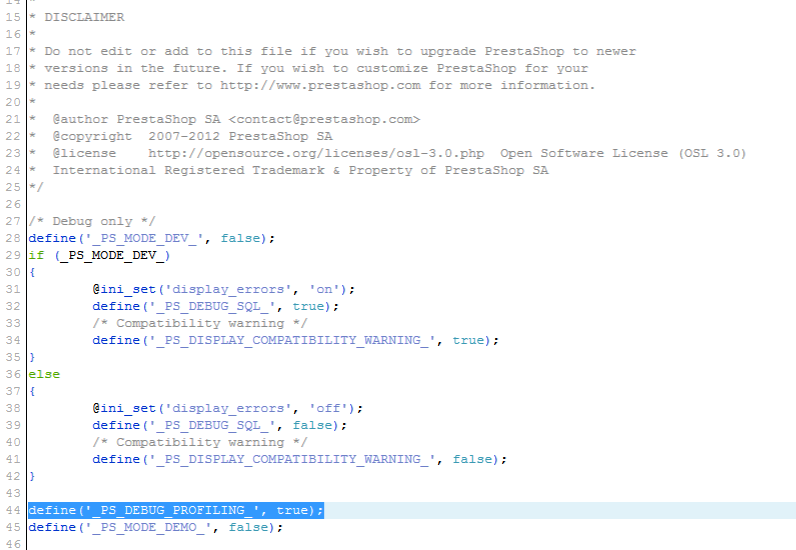 You will see a short list of files. Look for DEFINES.INC.PHP. Please make sure that you at least have a backup of this file (if not your entire installation), just in case unfortunate happens and the file is damaged. Better safe than sorry. Click on DEFINES.INC.PHP then right-click and select CODE EDITOR or click on the CODE EDITOR (or EDIT) in the menu at the top of the File Manager.
- In my code editor snap-shot, the code is on line 44, but just in case yours does not match up, look for "define('_PS_DEBUG_PROFILING_', false);". Change "false" to "true".
- Click on SAVE CHANGES in the top right hand corner of the editor.
This activates the DEBUG PROFILER, which evaluates all of the pieces running on any particular page of the PrestaShop website. Simply load any page and scroll to the bottom to see the results. This operates in both the front end and the back end, so be wary of running it when the public has access to your website. Here's an example what you may see with the DEBUG PROFILER in operation: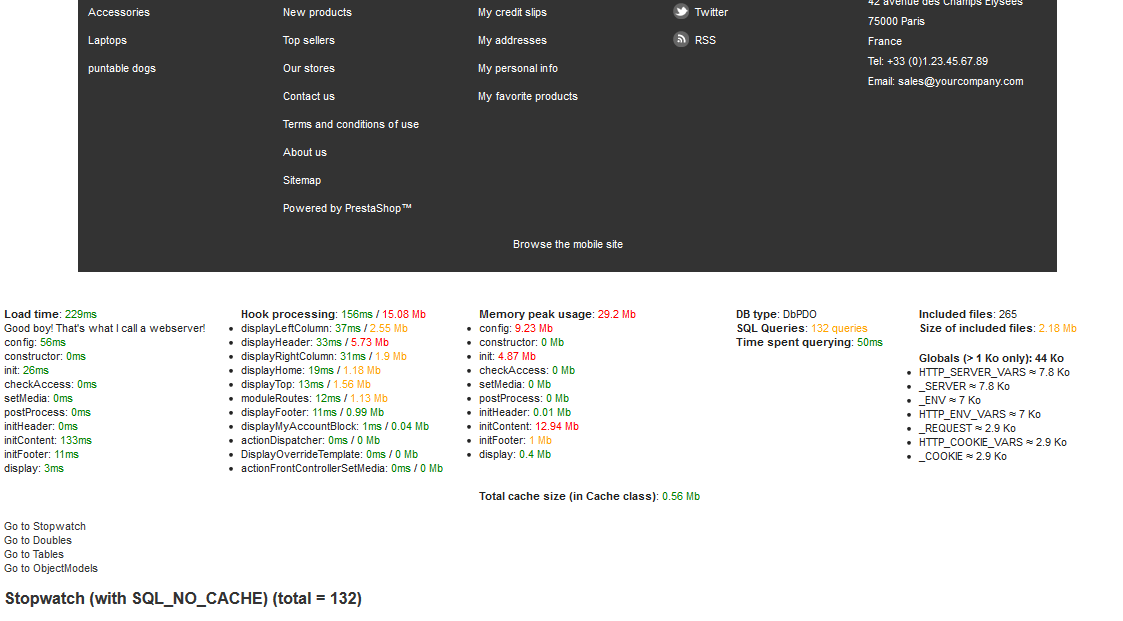
Note that the results are not complete (there is an extensive page of results). These results are very helpful for troubleshooting issues. Please use this option if you run into a performance issue with PrestaShop and are seeking data to identify possible causes.
Did you find this article helpful?
Tweet
Category
Prestashop 1.5
Help Center Login
Related Questions
Here are a few questions related to this article that our customers have asked:
Ooops! It looks like there are no questions about this page.
Would you like to ask a question about this page? If so, click the button below!

We value your feedback!
There is a step or detail missing from the instructions.
The information is incorrect or out-of-date.
It does not resolve the question/problem I have.
new! - Enter your name and email address above and we will post your feedback in the comments on this page!