Understanding the Stats Settings in PrestaShop 1.5
All of the reports generated in the Stats section have settings that include the graph engine, grid engine and an auto-clean period for use when displaying the data graphically. Each of the options are described and explained in the following article so that you can decide which option best works for your PrestaShop 1.5 installation.
Defining the Settings for the Stats in PrestaShop 1.5
- Log in to the PrestaShop Admin Dashboard as an Administrator
- Hover over the end of the menu bar to the right where it is labeled "STATS". Click on STATS when it appears in the drop-down menu.
- When you get to the main STATS DASHBOARD, go to the left-hand column labeled SETTINGS. You will see a section as per the screenshot below:
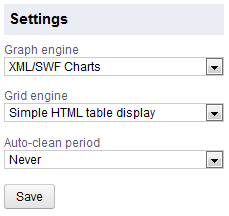
- Click on the option labeled GRAPH ENGINE and you will see the following options:
Artichow
Google Chart
Visifire
XML/SWF Charts
PrestaShop has graciously provided different graphical options using the above options. Each of these options shows the graph or chart in a different style. Click and choose each one until you find one that fits your personal preference of how the graphics should appear. - The next option below the GRAPH ENGINE is GRID ENGINE. Currently, unless you have another grid engine loaded, the only option available will be the SIMPLE HTML TABLE DISPLAY. This will not change the data, but only the way the data is displayed.
- The next option is Auto-clean period. The periods include: Never, Week, Month, Year.
This option is used to determine how the data used to generate the graphs or tables is cleared before presenting the data in graphic form.
Select the option you wish to use to clear data, or leave it on NEVER in order to continually show data as it comes into PrestaShop. - Click on the SAVE button in the bottom left hand corner in order to save your selection. You will need to click the save the option whenever you change the Graph engine. Then select the STATS option again to see it using the new Graph engine option.
The SETTINGS section for the STATS reports allows you to determine how data is presented graphically and how often the data is cleared before being displayed graphically. These options are used to change the way data appears, but does not change the actual data. Choose the option which best matches your preference and then present and analyze your shop data as per your needs. Here's are a few sample screenshots of the STATS report Visitors Origin using Google Charts and Visifire:
GOOGLE CHARTS: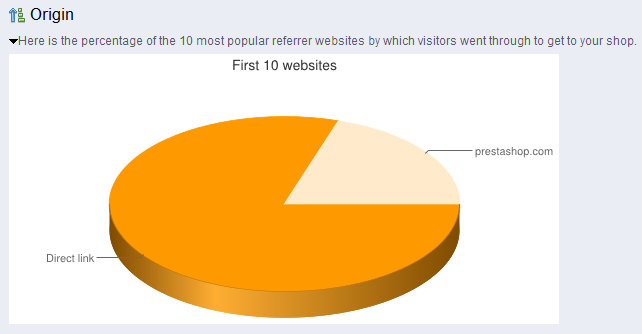
VISIFIRE: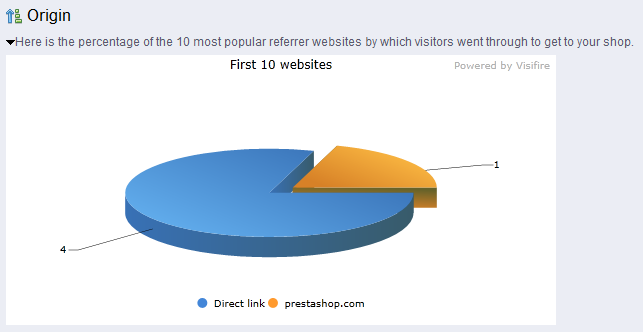
Did you find this article helpful?
Tweet
Category
Stats and Logs in PrestaShop 1.5
Help Center Login
Stats and Logs in PrestaShop 1.5
Related Questions
Here are a few questions related to this article that our customers have asked:
Ooops! It looks like there are no questions about this page.
Would you like to ask a question about this page? If so, click the button below!

We value your feedback!
There is a step or detail missing from the instructions.
The information is incorrect or out-of-date.
It does not resolve the question/problem I have.
new! - Enter your name and email address above and we will post your feedback in the comments on this page!